Introduction to Probability Models
Lecture 34
Qi Wang, Department of Statistics
Nov 12, 2018
5 Number Summary
5 Number Summary is consist of Minimum, $Q_1$, Median, $Q_3$, Maximum
Example 1
Here are Bob's last 20 golf scores, beginning with his last score: $$69, 73, 77, 77, 80, 76, 75, 77, 78, 78, 77, 81,82, 75, 79, 76, 83, 77, 80, 84$$ Calculate the 5 number summary
Boxplot
Boxplot is a graphic depiction of the 5 number summary
- Draw a horizontal or vertical axis that is evenly spaced and well-labeled(make sure it covers the full range of the data)
- Locate $Q_1$ and $Q_3$. There are the "ends" of your box. Draw the box.
- With the box, locate the Median and mark it
- Locate and mark the Minimum and Maximum. Extend a line("whisker") from each end of the box to the Max or Min
Modified Boxplot
Step 1, 2, 3 are the same, BUT we indicate the outliers with a $o$ or a $\star$. Then draw the line from the ends of the box ot the highest or lowest data point that is NOT an outlier. Most software generate boxplots are modified boxplots.
Population VS. Sample
Definitions
- Population is the set of ALL elements of interest in a particular study
- Census is designed to collect data from the entire population
- Sample is a subset of the population. We collect data from the sample to estimate and make inferences about the population.
- Population parameter are numerical measures of location, dispersion, shape, association that are computed FROM a POPULATION
- Sample statistics are numerical measures of location, dispersion, shape, association that are computed FROM a SAMPLE
- Statistical inference is the process of using data from a sample to make estimates, test hypotheses, or draw conclusions about the population characteristics.
Types of Sampling Methods
- Non-random Sampling
- Voluntary response sample: subjects select themselves to be in the sample group. Generally, people with strong opinions (especially negative opinions) are most likely to respond.
- Convenience sample: subjects are selected based on the ease of collecting the sample.
- Random Sampling
- Simple random sample: also called SRS; is selected in such a way that every possible sample of size n has an equal probability of being chosen
- Stratified random sample: elements in the population are first divided into groups (i.e. strata) and then an SRS is taken from each group.
- Cluster sample: the elements in the population are first divided into separate groups called clusters and a simple random sample of clusters are chosen. All the elements in the chosen cluster are then in the final sample.
- Systematic sample: the elements in the population are given a numeric identifier. We randomly select one of the first k elements in the population. Then we choose every kth element after that first one to be in the sample.
Randomization
- How to Randomize? Usually done with software that utilizes a random number generator, or it can be done by hand with a random number table. Elements in the population are given a numeric identifier.
- Why randomize? As stated earlier, in order to fully represent the population so that we make valid conclustion about that population
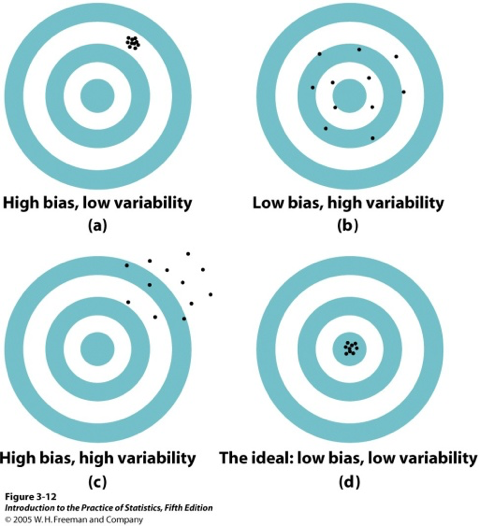
Bias and Variablility
- Bias concerns the center of the sampling distribution. Your result are biased if the statistic for your sampling distribution is not at the population parameter. Choosing a random sample will reduce bias
- Variablility describes how spread out the sampling distribution is for the statistic. This spread is determined by the sampling design and the sample size n. Larger sample size have smaller variabiation - the population size is not important to variation since your population size is fixed