Introduction to Probability Models
Lecture 30
Qi Wang, Department of Statistics
Nov 2, 2018
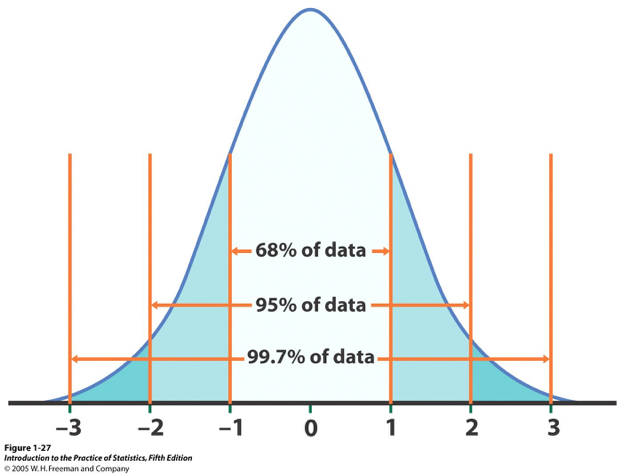
The Empirical Rule
$X \sim N(\mu, \sigma)$
- Approximately 68% of the observations fall within $1 \sigma$ of the mean $\mu$ $$P(\mu - \sigma < X < \mu + \sigma) = 0.68$$
- Approximately 95% of the observations fall within $2 \sigma$ of the mean $\mu$ $$P(\mu - 2\sigma < X < \mu + 2\sigma) = 0.95$$
- Approximately 99.7% of the observations fall within $3 \sigma$ of the mean $\mu$ $$P(\mu - 3\sigma < X < \mu + 3\sigma) = 0.997$$
Example 1
Checking account balances, X, are approximately normal with a mean of 1500 dollars and a standard deviation of 50 dollars
- Between what numbers do 95% of the balances fall?
- Above what number do 2.5% of the balances lie?
- Approximately what % of balances are between 1400 dollars and 1550 dollars?
- Approximately what % of the balances are less than 1450 dollars?
“Backwards” Normal Problems
What if we know the probability and want to find the related z-score and the value in the original distribution? We will work the table backwards!
Steps to finding the sample score if you are given a probability and know $X \sim N(\mu, \sigma)$
- Set up your problem as follows $P(Z \le z_0) = probability$(Note: adjust $>$to $\le$ if necessary by using “1-probability”.)
- Find the z-score by looking up the probability in the body of normal table
- If you have a two-sided probability, use $$P(-z_0 < Z \le z_0) = 2P(Z \le z_0) - 1 = 2 \Phi(z_0) - 1$$
- Convert the z-score to x using $$z = \frac{x - \mu}{\sigma}$$
Example 2
Find for each of the following:
- $P(Z < z_0) = 0.5$
- $P(Z < z_0) = 0.9846$
- $P(Z < z_0) = 0.95$
- $P(Z > z_0) = 0.512$
- $P(-z_0 < Z < z_0) = 0.5$
Example 3
If $X\sim N(\mu = 4, \sigma = 1.5)$, find $x_0$ for each of the following:
- $P(X < x_0) = 0.95$
- $P(X < x_0) = 0.90$
- $P(X > x_0) = 0.9236$
- Find 2 values between which the center 30% of the data lies.
Example 4
The weekly amount spent for maintenance and repairs at a certain company has an approximately normal distribution with a mean of 650 dollars and a standard deviation of 35 dollars.
- What is the probability that the company spends less than 675 dollars on maintenance and repairs in one week?
- If 725 dollars is budgeted to cover the maintenance/repairs for next week, what is the probability that the actual cost will exceed the budgeted amount?
- For planning purposes, the company wants to know the range for the middle 60% of the distribution of weekly maintenance and repair costs. Find the values that determine the middle 60% of the distribution of maintenance/repair costs.
- What should the company expect their maintenance/repair costs to be for a year? .